|
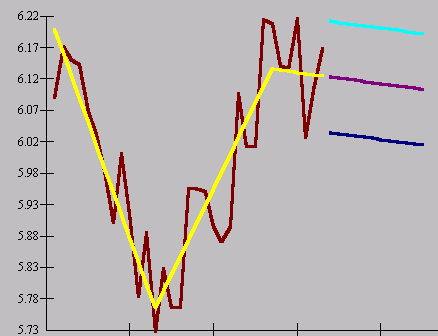
This is an example of what is called Simpson's Paradox.
The apparent association is due to the omission of some
important information. When the omitted variable is brought into
the model the association is cancelled. In time series data
it is possible to identify level shifts which may act as a
proxy for the omitted variable thus identifying the point in
time when the true cause variable changed "state".
In the example of house fires, the size
of the fire needs to be taken into account --- more
firefighters are sent to larger fires and the larger the
fires, the worse the damage. In cases like this, i.e.
cross-sectional data it is not possible to develop a proxy
for the omitted variable as is often the case in time series
analysis.
If you consider fire size as categorical (e.g. small, medium, large), the overall effect is that more firemen (seem to) imply more damage; however, within each category of fire, more firemen imply *less* damage. The relationship for every subgroup is the opposite of the relationship for the entire group taken as a whole. |  |
|---|

