SPURIOUS CORRELATION AND IT'S DETECTION

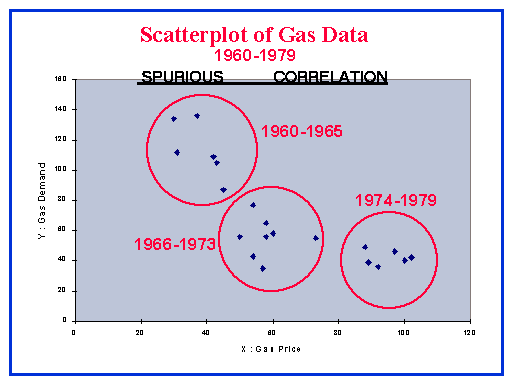
We show how gas demand levels (target or DEPENDENT variable) seems to vary with the price of the gas (INDEPENDENT variable) for a series of gas utilities in a large country. The data relates to what an economist would call the Price/Demand relationship and is an example of Simpson's Paradox.

    The first step is to plot the Independent (also called Predictor) variable as x (horizontal axis) against the Dependent (also called Predicted) variable as y (vertical axis). Examination of the SCATTERPLOT suggests a curved relationship. So, a straight line may be too simple a model to extract all the relationship information in the data.

    Various tools to make the data behave by transformations or curved relationships are often presented in the spirit of "if at first you don't succeed transform the data".

    A straight line may be too simple a model to extract all the relationship information in the data. Nevertheless, it is useful to see how well a straight line as a model of the Price Demand relationship would work in this case and how evaluation of the model can bring out the difficulties.

Here are the interpretation of the different elements of the Linear Regression line.

A logarithmic transformation is sometimes necessary to make the variance of the errors homogenous or constant. If the original data exhibits a correlation between the level of the series and the standard deviation then one should "uncouple" this relationship by taking logarithms. A transformation does not seem warranted in this case.

In the case of Demand for Gas as it relates to the Price of Gas, we will show the presence or effect of an omitted variable or "lurking variable". It is not within the scope of statistics to identify the true albeit omitted variable, but rather to report the conclusion that one may exist and the need to do identify it. Additionally, the timing of such events may lead to true knowledge. Outliers represent unexpected events and consequently are often the source of true discovery.

If you control for time, a surrogate perhaps for a policy variable or some unspecified cause, a totally different message is perceived. There is no relationship whatsoever between these two variables locally.

A correct analysis of this data would lead to the conclusion that there was no statistically significant correlation given that time or "class of time" was taken into account.

Modern time series analysis identified two level shift variables which when incorporated into the model reduced the correlation between Price and Demand thus exposing the Spurious Correlation. Thus the data suggests that there were three regimes spanning the 20 years and once you controlled for these regimes the correlation or causality between price and gas vanishes.

Fitting Ain't Modelling ( Things Not To DO ! )

The data.

CLICK HERE:Home Page For AUTOBOX