Tom Reilly
Waging a war against how to model time series vs fitting
IBM just launched SPSS Modeler 18. Let's look underneath the hood, but why?
- Font size: Larger Smaller
- Hits: 65120
- 0 Comments
- Subscribe to this entry
- Bookmark
IBM released version SPSS Modeler 18 recently and with it a 30 day trial version.
We tested it and have more questions than answers. We would be glad to hear any opinions(as always) differing or adding to ours.
There are 2 sets of time series examples included with the 30 day trial.
We went through the first 5 "broadband" examples that come with the trial that are set to run by default. The 5 examples have no variability and would be categorized as "easy" to model and forecast with no visible outliers. This makes us wonder why there is no challenging data to stress the system here?
For series 4 and 5 both are find to have seasonality. The online tutorial section called "Examining the data" talks about how Modeler can find the best seasonal models or nonseasonal models. They then tell you that it will run faster if you know there is no seasonality. I think this is just trying to avoid bad answers and under the guise of it being "faster". You shouldn't need to prescreen your data. The tool should be able to identify seasonality or if there is none to be found. The ACF/PACF statistics helps algorithms(and people) to help identify seasonality. On the flipside, a user may think there is no seasonality in there data when there actually is so let's take the humans out of the equation.
The broadband example has the raw data and we will use that as we can benchmark it. If we pretend that the system is a black box and just focused on the forecast, most would visually say that it looks ok, but what happens if we dig deeper and consider the model that was built? Using simple and easy data avoids the difficult process of admitting you might not able complicated data.
The default is to forecast out 3 periods. Why? With 60 months of data, why not forecast out at least one cycle(12)? The default is NOT to search and adjust for outliers. Why? They certainly have many varieties of offerings with respect to outliers, but makes me wonder if they don't like the results? If you enable outliers only "additive" and "level shift" are used unless you go ahead a click to enable "innovational", "transient", "seasonal additive", "local trends", and "additive patch". Why are these not part of the typical outlier scheme?
When you execute there is no audit trail of how the model go to its result. Why?
You have the option to click on a button to report "residuals"(they call them noise residuals), but they won't generate in the output table for the broadband example. We like to take the residuals from other tools and run them in autobox. If a mean model is found then the signal has been extracted from the noise, but if Autobox finds a pattern then the model was insufficient...given Autobox is correct. :)
There is no ability to report out the original ACF/PACF being reported. This skips the first step for any statistician to see and follow why SPSS would select a seasonal model for example 4 and 5. Why?
There are no summary statistics showing mean or even number of observations. Most statistical tools provide these so that you can be sure the tool is in fact taking in all of the data correctly.
SPSS logs all 5 time series. You can see here how we don't like the kneejerk movement to use logs.
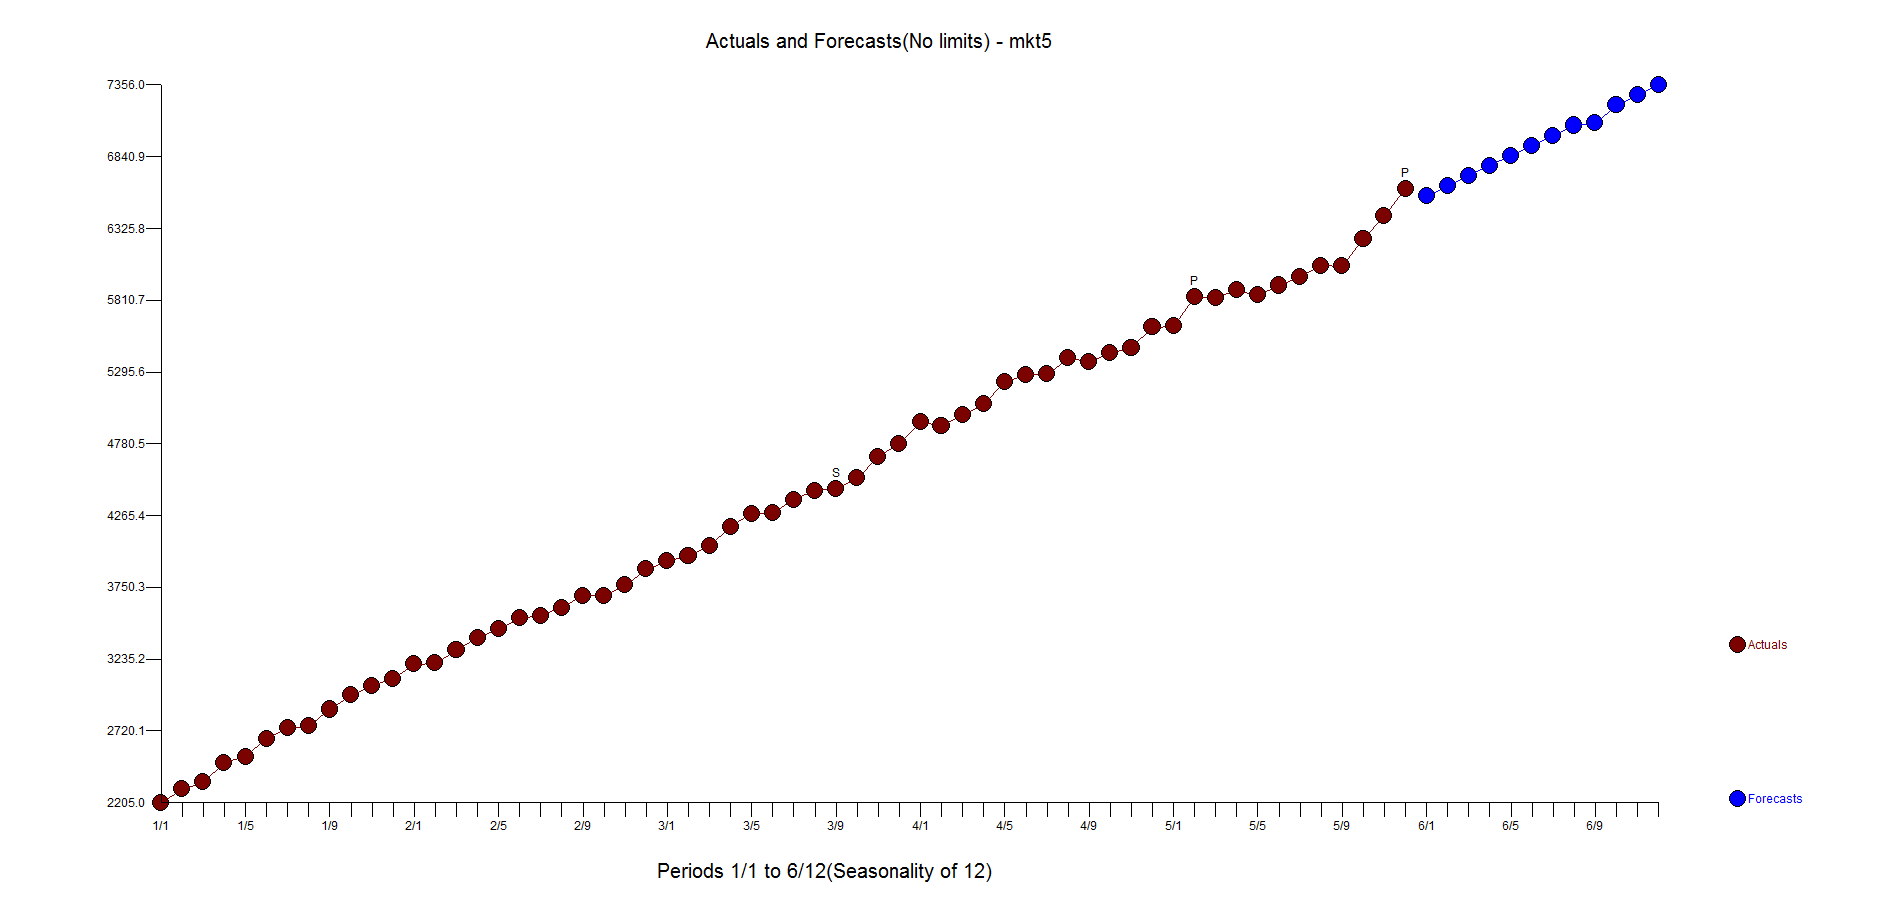
We don't understand why differencing isn't being used by SPSS here. Let's focus on Market 5. Here is a graph and forecast from Autobox
Let's assume that logs are necessary(they aren't) and estimate the model using Autobox and auto.arima and both software uses differencing. Why is there no differencing used by SPSS for a non-stationary series? This approach is most unusual. Now, let's walk that back and run Autoboc and NOT use logs and differencing is used with two outliers and a seasonal pulse in the 9th month(and only the 9th month!). So, let's review. SPSS finds seasonality while Autobox & Auto.arima don't.
How did SPSS get there? There is no audit of the model building process. Why?
We don't understand the Y scale on the plots as it has no relationship to the original data or the logged data.
The other time series example is called "catalog forecast". The data is called "men". They skip the "Expert modeler" option and choose "Exponential Smoothing". Why?
This example has some variability and will really show if SPSS can model the data. We aren't going to spend much time with this example. The graph should say it all. Autobox vs SPSS
The ACF/PACF shows a spike at lag 12 which should indicate seasonality. SPSS doesn't identify any seasonality. Autobox also doesn't declare seasonality, but it does identify that October and December's do have seasonality (ie seasonal pulse) so there is some months which are clearly seasonal. Autobox identifies a few outliers and level shift signifying a change in the intercept(ie interpret that as a change in the average).
If we allow the "Expert Modeler", the model identified is a Winter's additive Exponential smoothing model.
We took the SPSS residuals and plotted them. You want random residuals and these are not it. If you mismodel you can actually inject structure and bias into the residuals which are supposed to be random. In this case, the residuals have more seasonality(and two separate trends?) due to the mismodeling then they did with the original data. Autobox found 7 months to be seasonal which is a red flag.
I think we know "why" now.
Comments
-
Please login first in order for you to submit comments


