www.autobox.com - Automatic Forecasting Systems

Tom Reilly
Waging a war against how to model time series vs fitting
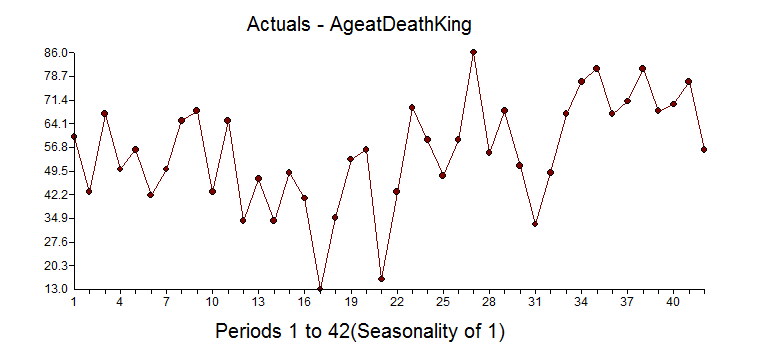
Great time series analysis example using the "Ages at Death of the Kings of England" Dataset

- Font size: Larger Smaller
- Hits: 205253
- 0 Comments
- Subscribe to this entry
- Bookmark
This is a great example of how ignoring outliers can make you analysis can go very wrong. We will show you the wrong way and then the right way. A quote comes to mind that said "A good forecaster is not smarter than everyone else, he merely has his ignorance better organized".
It begins at William the Conqueror from the year 1028 to present(excluding the current Queen Elizabeth II) and shows the ages at death for 42 kings. It is an interesting example in that there is an underlying variable where life expectancy gets larger over time due to better health, eating, medicine, cyrogenic chambers???, etc and that is ignored in the "wrong way" example. We have seen the wrong way example as they are not looking for deterministic approaches to modeling and forecasting. Box-Jenkins ignored deterministic aspects of modeling when they formulated the ARIMA modeling process in 1976. The world has changed since then with research done by Tsay, Chatfield/Prothero (Box-Jenkins seasonal forecasting: Problems in a case study(with discussion)” J. Roy Statist soc., A, 136, 295-352), I. Chang, Fox that showed how important it is to consider deterministic options to achieve at a better model and forecast.
As for this dataset, there could be an argument that there would be no autocorrelation in the age between each king, but an argument could be made that heredity/genetics could have an autocorrelative impact or that if there were periods of stability or instability of the government would also matters. There could be an argument that there is an upper limit to how long we can live so there should be a cap on the maximum life span.
If you look at the dataset knew nothing about statistics, you might say that the first dozen obervations look stable and see that there is a trend up with some occasional real low values. If you ignored the outliers you might say there has been a change to a new higher mean, but that is when you ignore outliers and fall prey to Simpson's paradox or simply put "local vs global" inferences.
If you have some knowledge about time series analysis and were using your "rule book"on how to model, you might look at the ACF and PACF and say the series has no need for differencing and an AR1 model would suit it just fine. We have seen examples on the web where these experts use their brain and see the need for differencing and an AR1 as they like the forecast.
You might (incorrectly), look at the Autocorrelation function and Partial Autocorrelation and see a spike at Lag 1 and conclude that there is autocorrelation at lag 1 and then should then include an AR1 component to the model. Not shown here, but if you calculate the ACF on the first 10 observations the sign is negative and if you do the same on the last 32 observations they are positive supporting the "two trend" theory.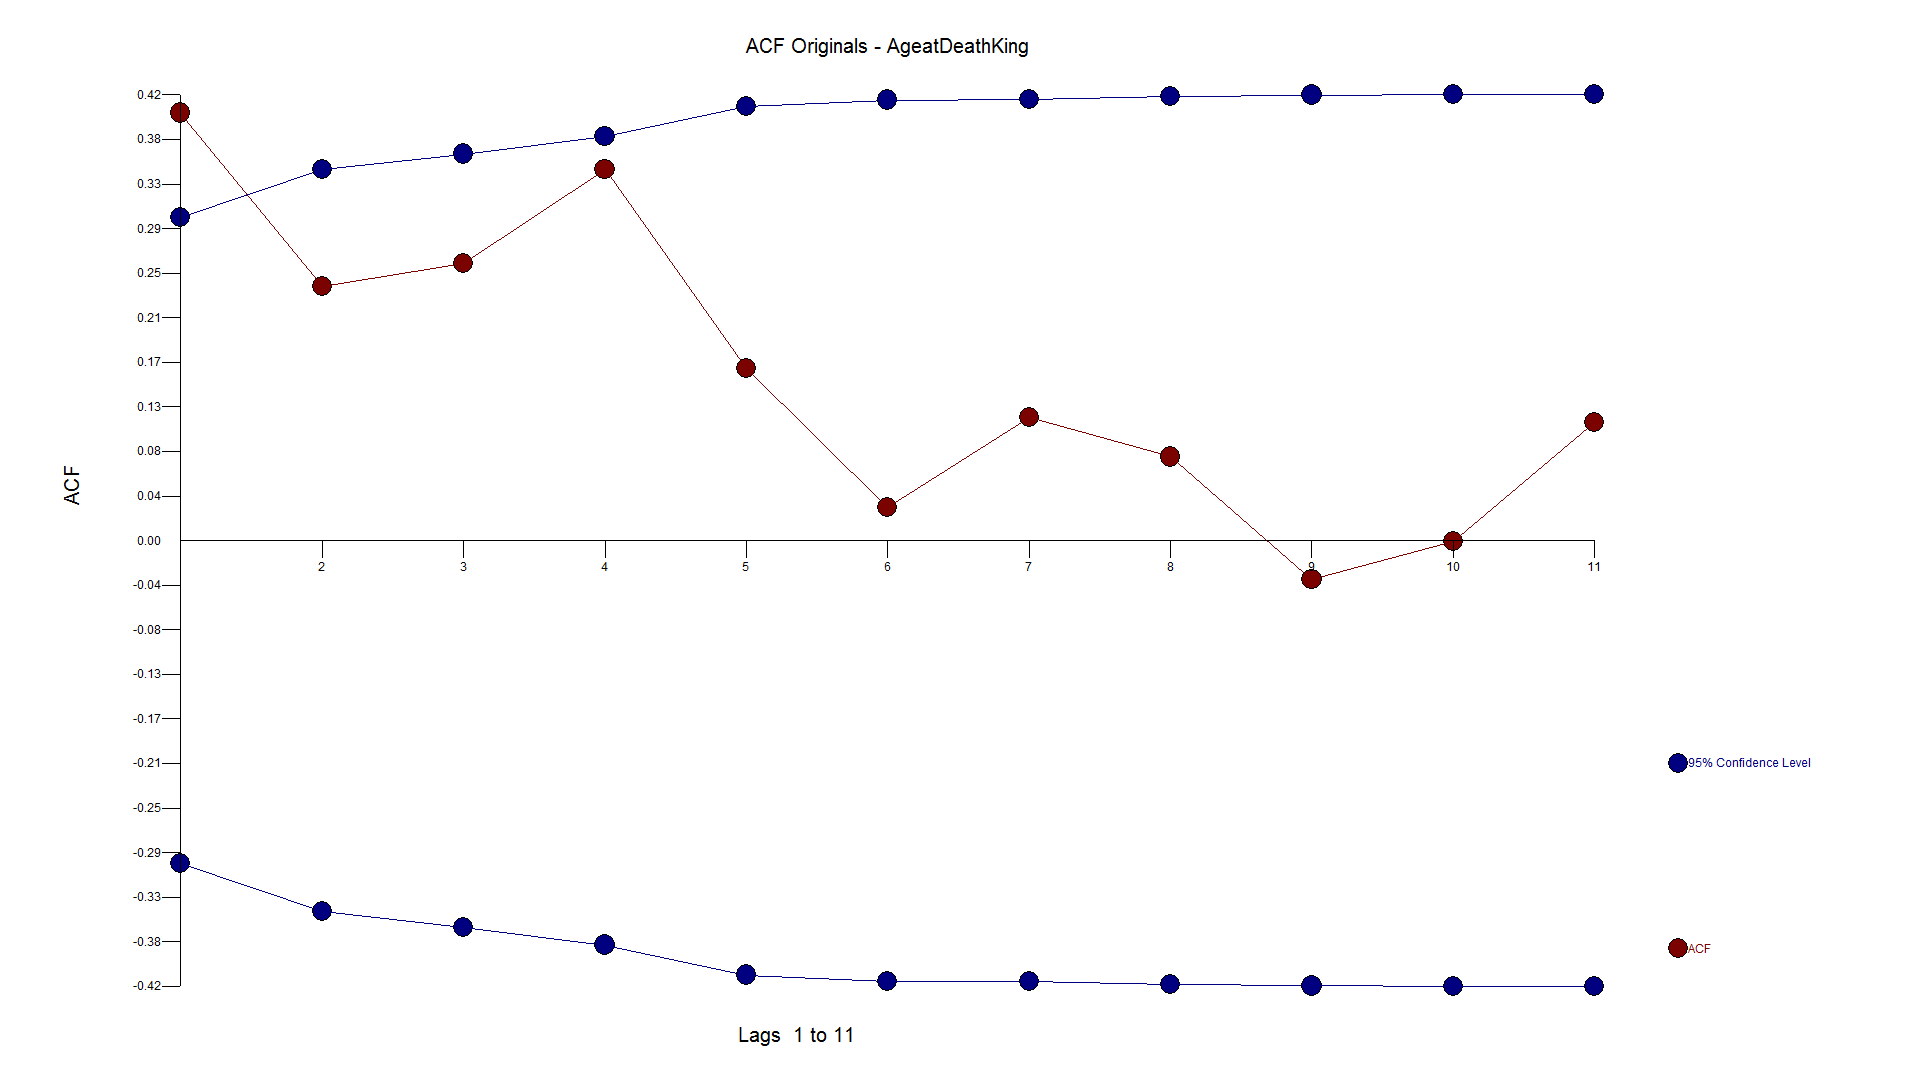
The PACF looks as follows: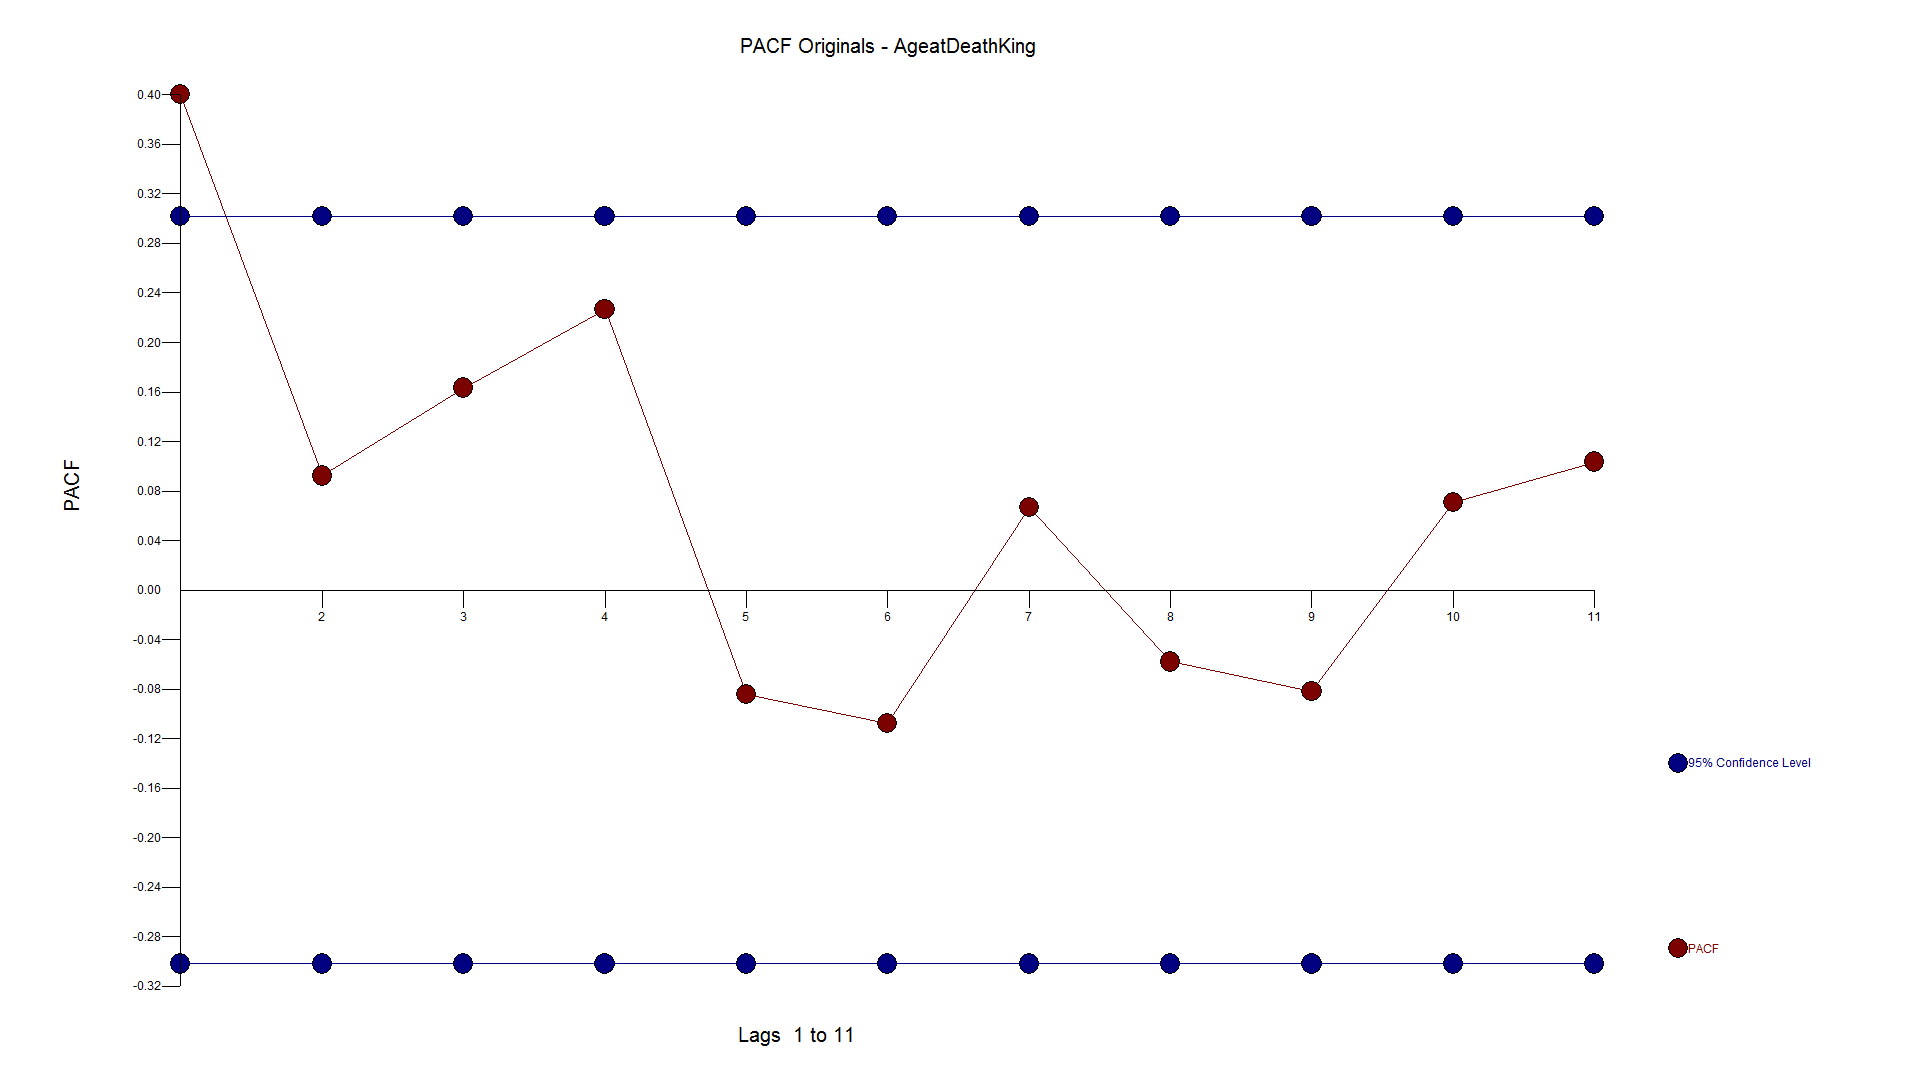
Here is the forecast when using differencing and an AR1 model. 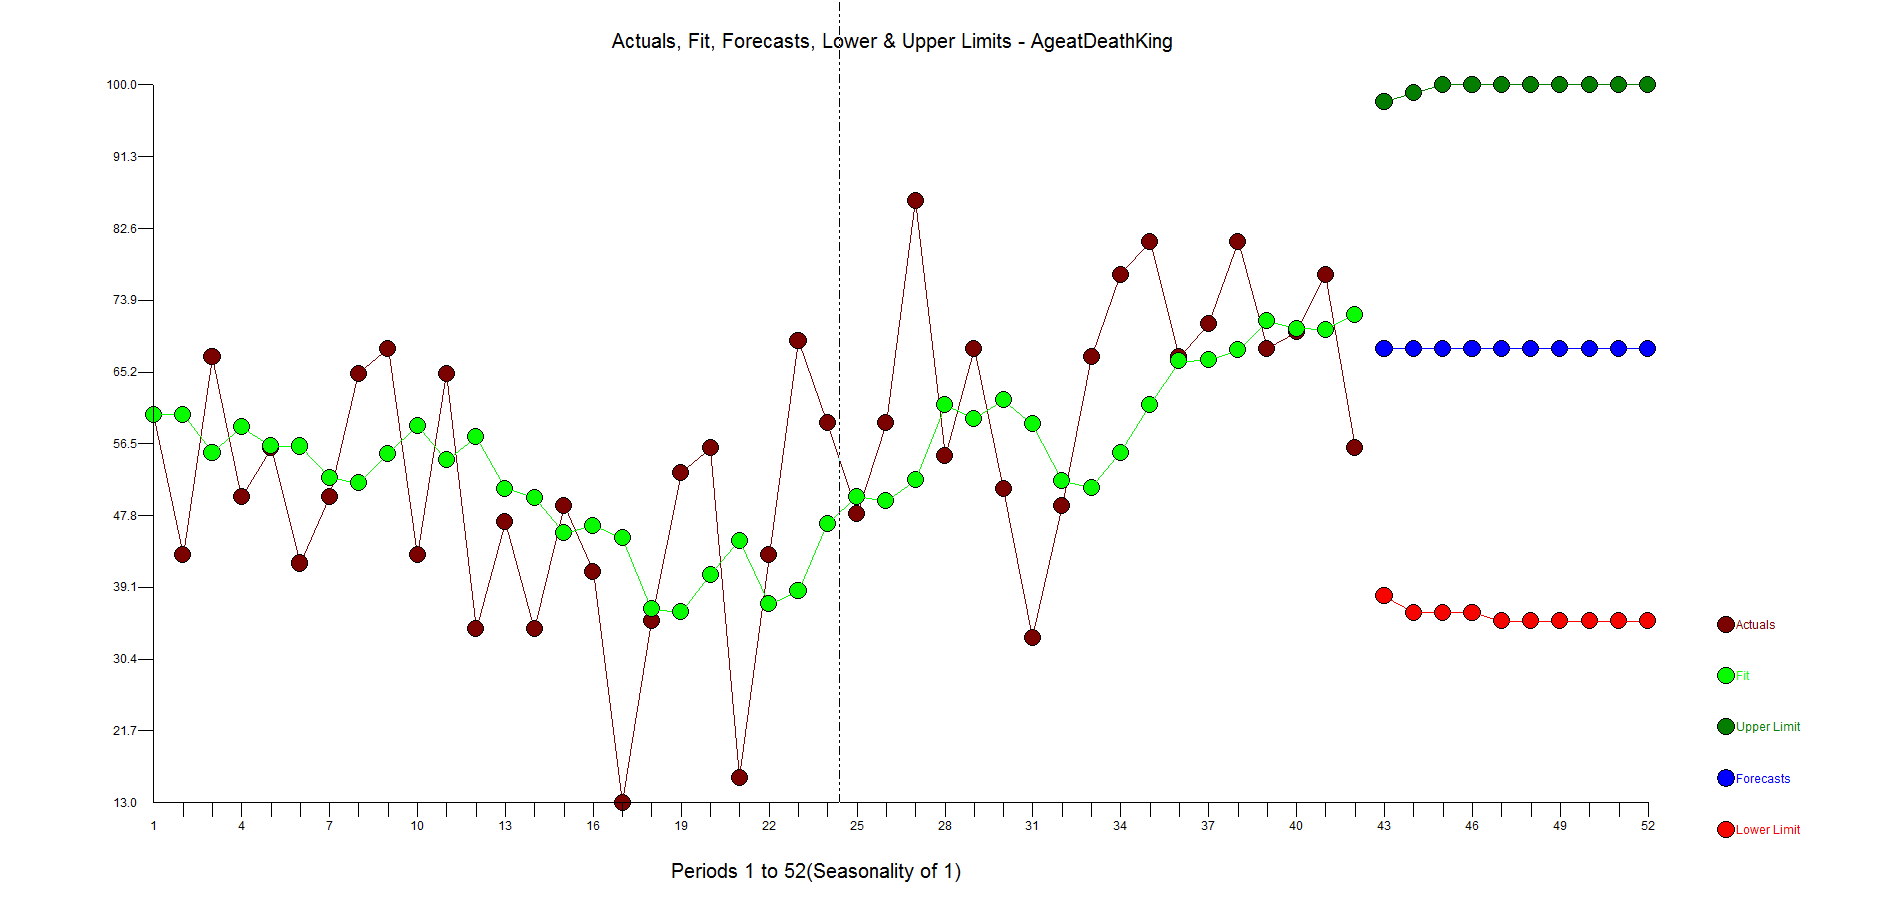
The ACF and PACF residuals look ok and here are the residuals. This is where you start to see how the outliers have been ignored with big spikes at 11,17,23,27,31 with general underfitting with values in the high side in the second half of the data as the model is inadequate. We want the residuals to be random around zero.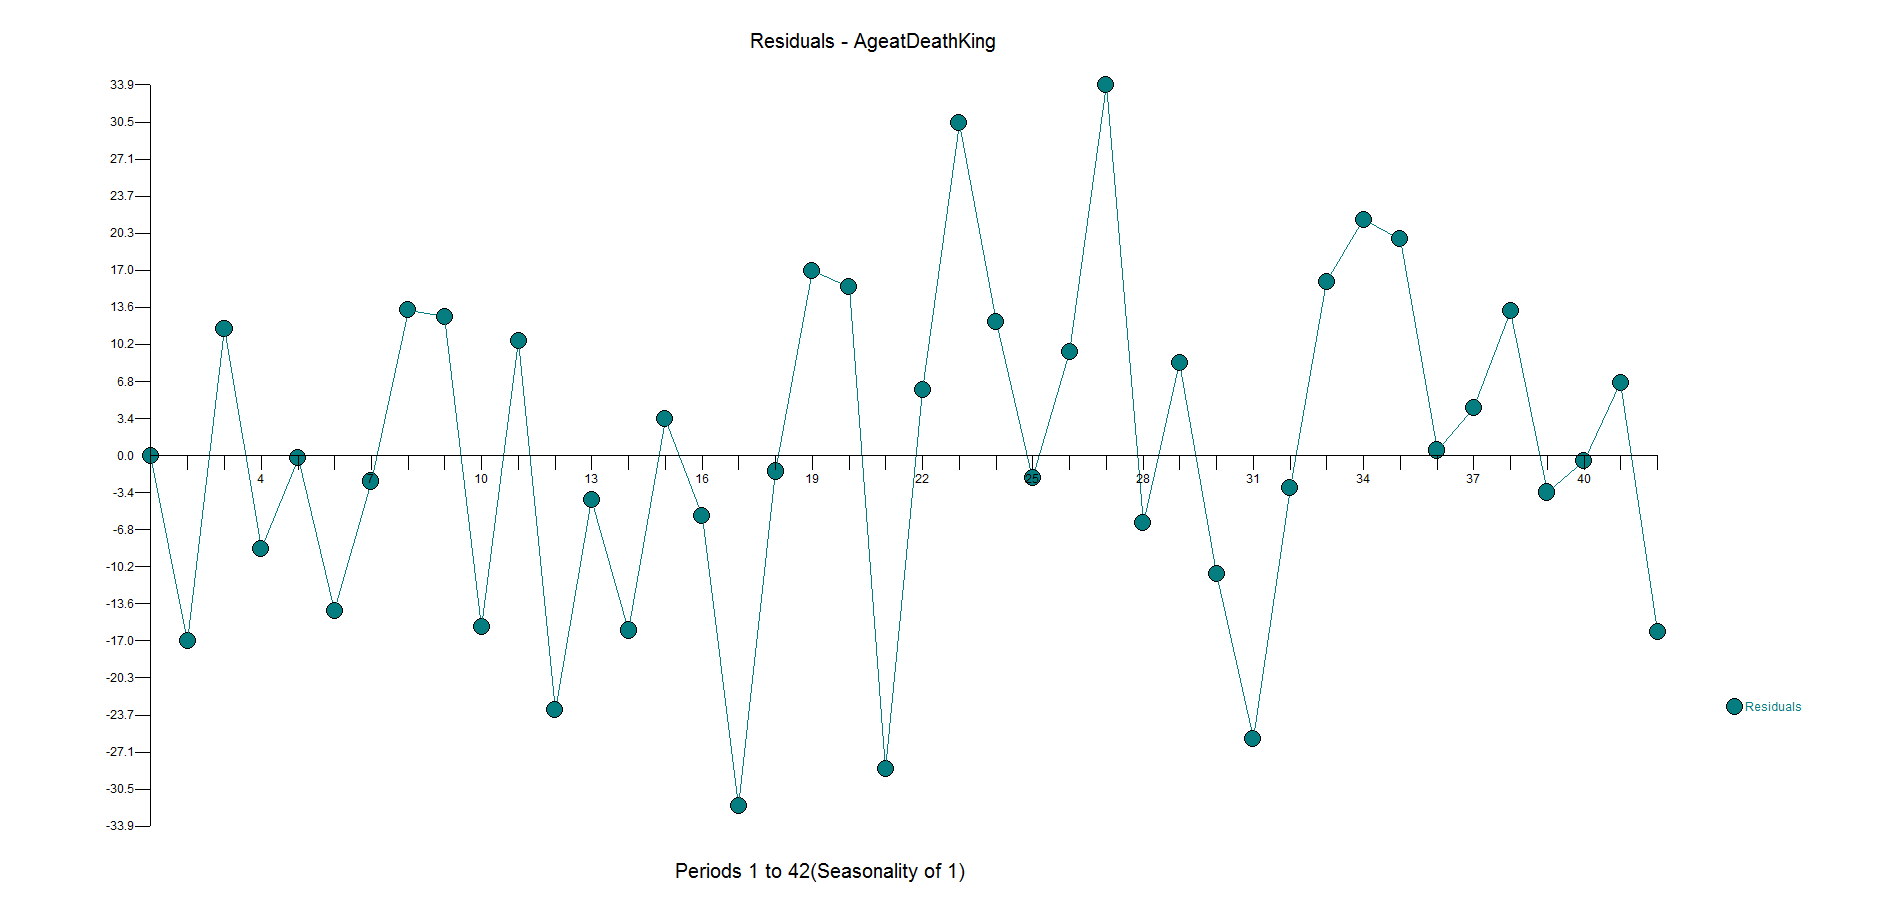
Now, to do it the right way....and with no human intervention whatsoever.
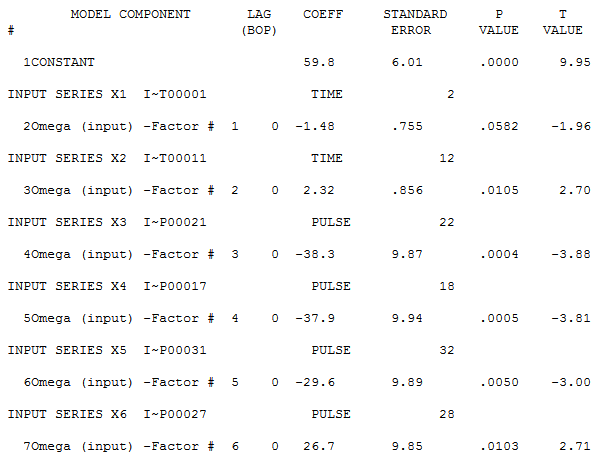
Autobox finds an AR1 to be significant and brings in a constant. It then identifies to time trends and 4 outliers to be brought into the model. We all know what "step down" regression modeling is, but when you are adding variables to the model it is called "step up". This is what is lacking in other forecasting software.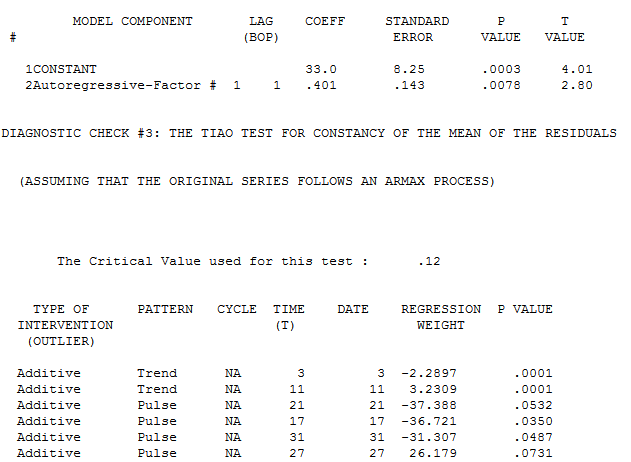
Note that the first trend is not significant at the 95% level. Autobox uses a sliding scale based on the number of observations. So, for large N .05 is the critical value, but this data set only has 42 observations so the critical value is adjusted. When all of the variables are assembled in the model, the model looks like this:
If you consider deterministic variables like outliers, level shifts, time trends your model and forecast will look very different. Do we expect people to live longer in a straight line? No. This is just a time series example showing you how to model data. Is the current king (Queen Elizabeth II) 87 years old? Yes. Are people living longer? Yes. The trend variable is a surrogate for the general populations longer life expectancy.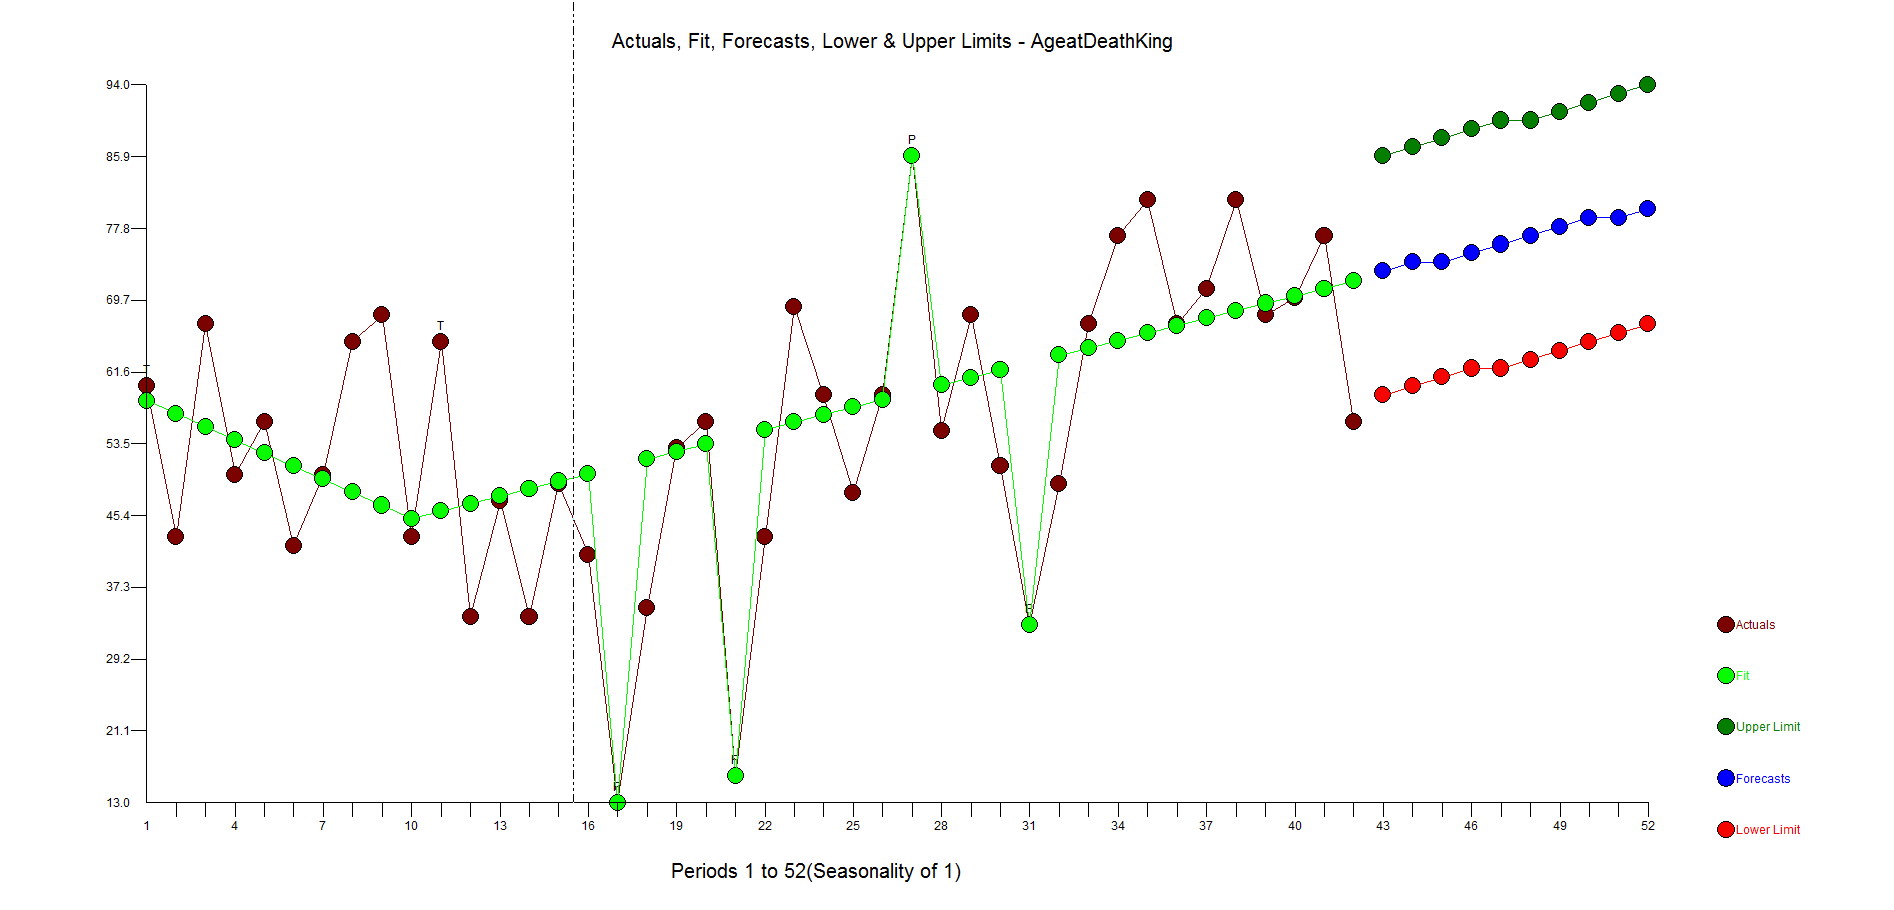
Here are the residuals. They are pretty random. There is some underfitting in the middle part of the dataset, but the model is more robust and sensible than the flat forecast kicked out by the difference, AR1 model.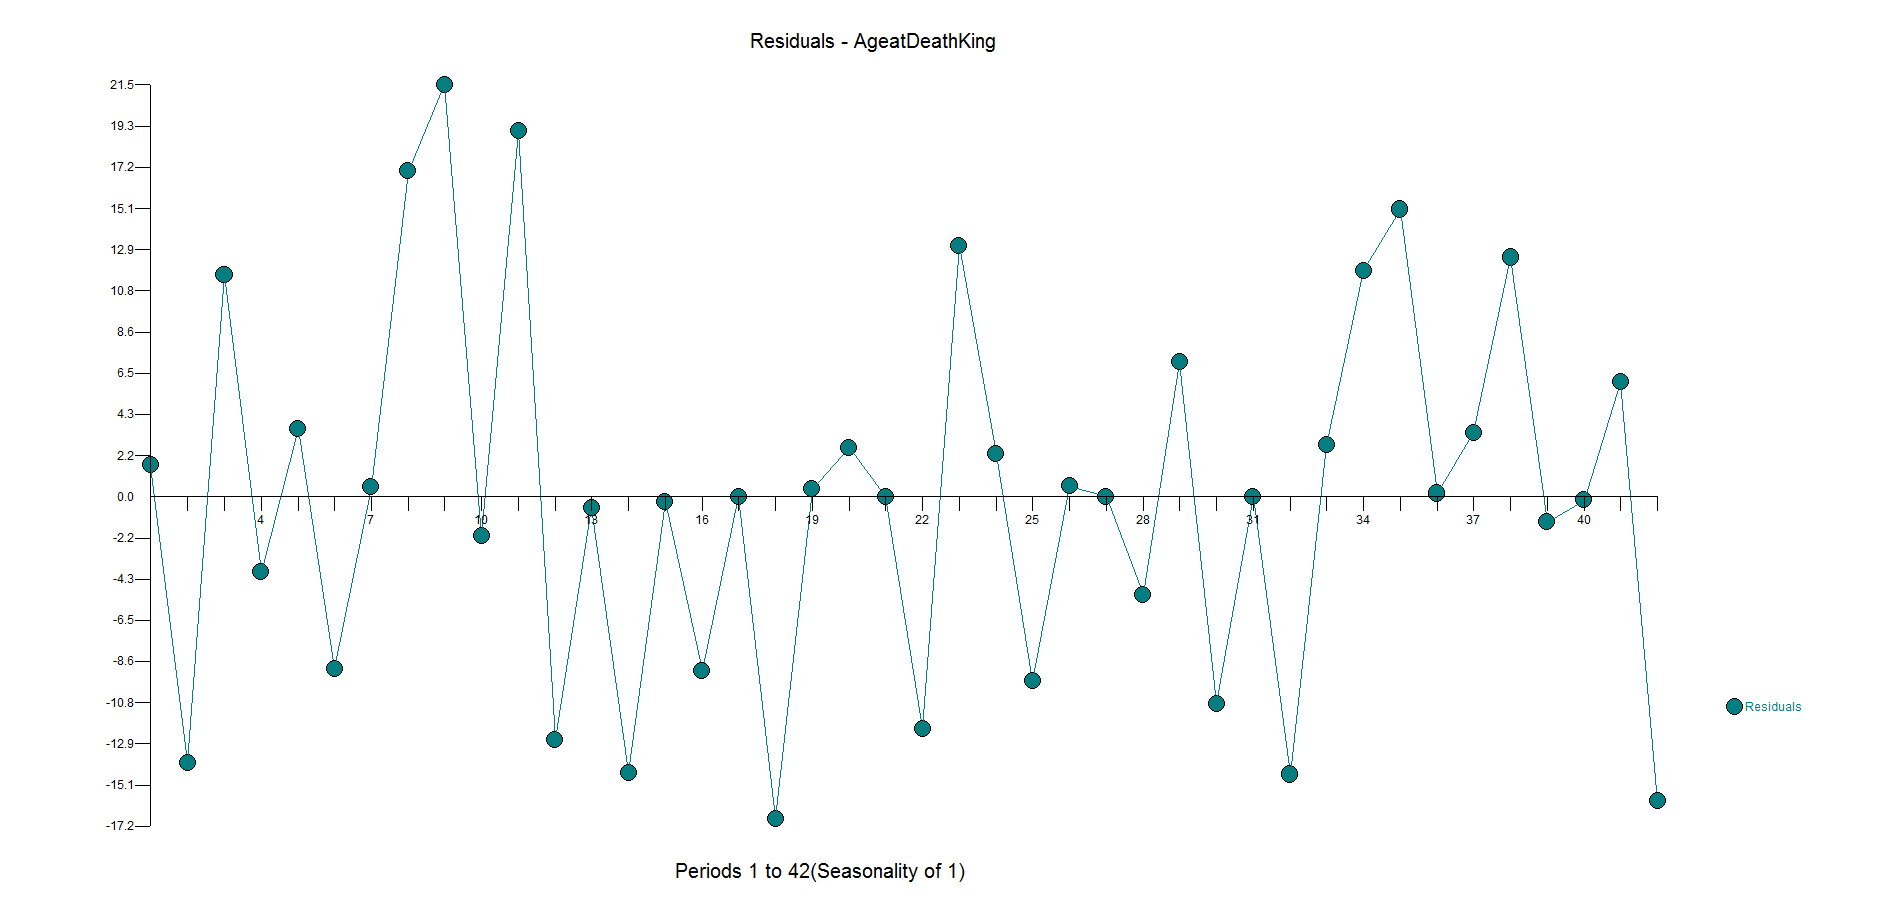
Here is the actual and cleansed history of outliers. Its when you correct for outliers that you can really see why Autobox is doing what it is doing. 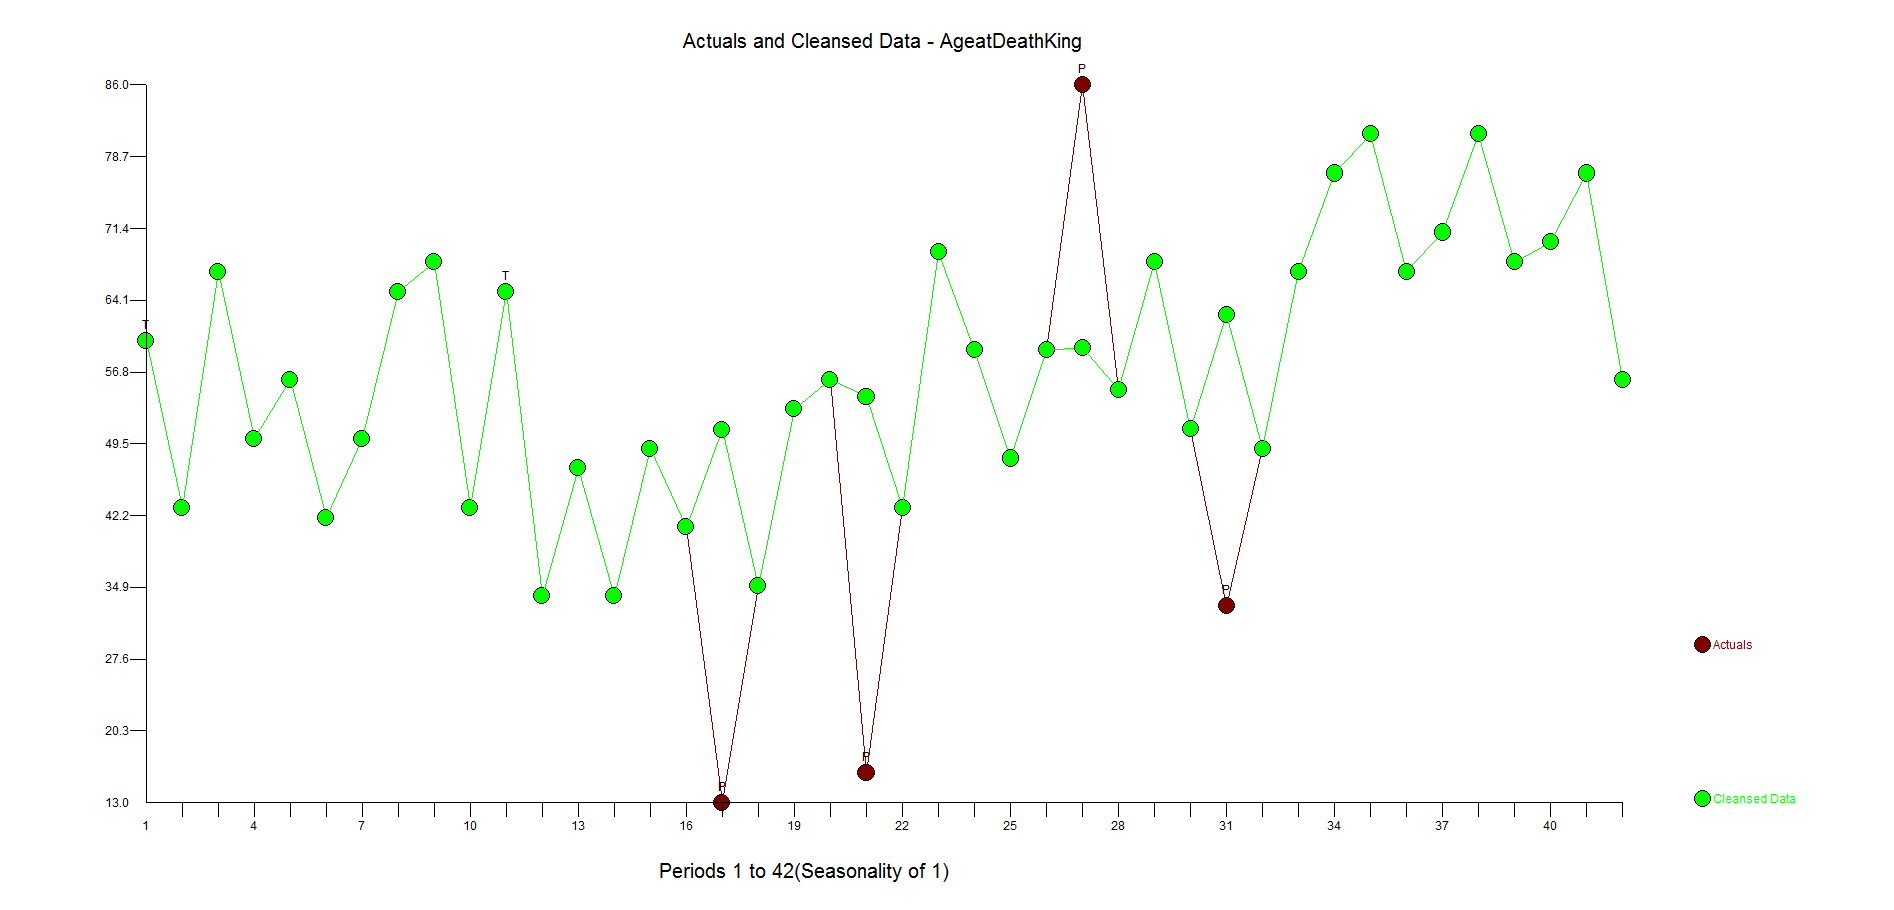
Comments
-
Please login first in order for you to submit comments


