Tom Reilly
Waging a war against how to model time series vs fitting
Alteryx is using R's forecast package. Autobox models the data better in their time series example. Not really news.
- Font size: Larger Smaller
- Hits: 76815
- 0 Comments
- Subscribe to this entry
- Bookmark
Alteryx is using the free "forecast" package in R. This BLOG is really more about the R forecast package then it is Alteryx, but since this is what they are offering.....
In their example on forecasting(they don't provide the data with Alteryx that they review, but you can request it---we did!), they have a video tutorial on analyzing monthly housing starts.
While this is only one example(we have done many!!). They use over 20 years of data. Kind of unnecessary to use that much data as patterns and models do change over time, but it only highlights a powerful feature of Autobox to protect you from this potential issue. We will discuss down below the use of the Chow test.
With 299 observations they determine of two alternative models (ie ETS and ARIMA)which the best model using the last 12 making a total of 311 observations used in the example. The video says they use 301 observations, but that is just a slight mistake. It should be noted that Autobox doesn't ever withhold data as it has adaptive techniques which USE all of the data to detect changes. It also doesn't fit models to data, but provides "a best answer". Combinations of forecasts never consider outliers. We do.
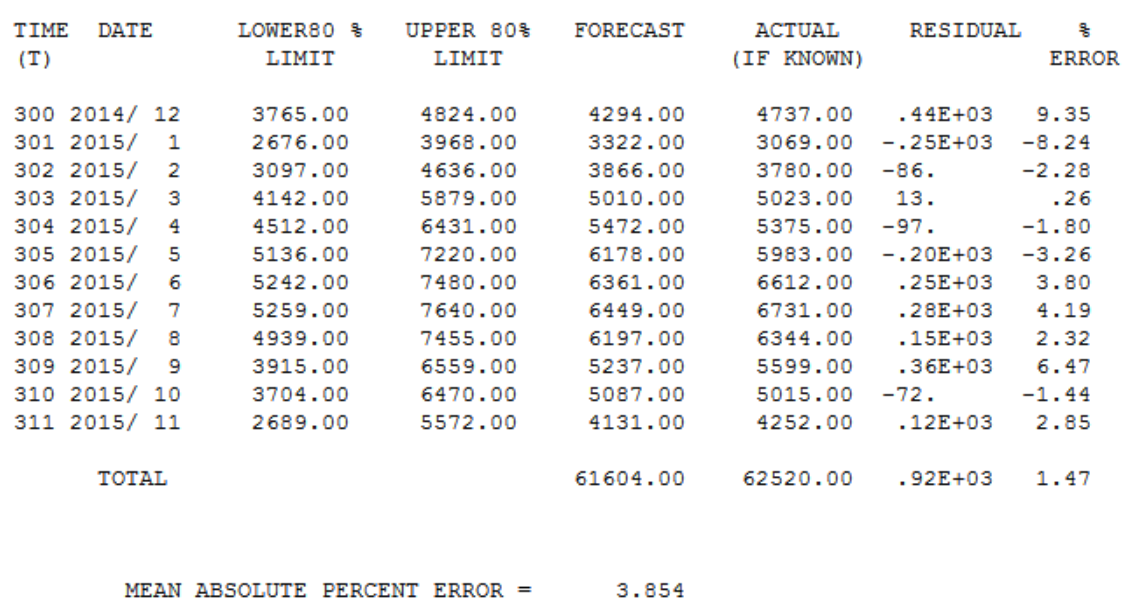
The MAPE for ARIMA was 5.17 and ETS was 5.65 which is shown in the video. When running this in Autobox using the automatic mode, it had a 3.85 MAPE(go to the bottom). That's a big difference by improving accuracy by >25%. Here is the model output and data file to reproduce this in Autobox.
Autobox is unique in that it checks if the model changes over time using the Chow test. A break was identified at period 180 and the older data will be deleted.
      DIAGNOSTIC CHECK #4: THE CHOW PARAMETER CONSTANCY TEST
             The Critical value used for this test :     .01
             The minimum group or interval size was:     119

                    F TEST TO VERIFY CONSTANCY OF PARAMETERS

           CANDIDATE BREAKPOINT       F VALUE          P VALUE

               120 1999/ 12           4.55639          .0039929423
               132 2000/ 12           7.41461          .0000906435
               144 2001/ 12           8.56839          .0000199732
               156 2002/ 12           9.32945          .0000074149
               168 2003/ 12           7.55716          .0000751465
               180 2004/ 12           9.19764          .0000087995*

* INDICATES THE MOST RECENT SIGNIFICANT  BREAK POINT:    1% SIGNIFICANCE LEVEL.

  IMPLEMENTING THE BREAKPOINT AT TIME PERIOD    180: 2004/   12

  THUS WE WILL DROP (DELETE) THE FIRST   179 OBSOLETE OBSERVATIONS
  AND ANALYZE THE MOST RECENT   120 STATISTICALLY HOMOGENOUS OBSERVATIONS
DIAGNOSTIC CHECK #4: THE CHOW PARAMETER CONSTANCY TEST The Critical value used for this test : .01 The minimum group or interval size was: 119 F TEST TO VERIFY CONSTANCY OF PARAMETERS CANDIDATE BREAKPOINT F VALUE P VALUE 120 1999/ 12 4.55639 .0039929423 132 2000/ 12 7.41461 .0000906435 144 2001/ 12 8.56839 .0000199732 156 2002/ 12 9.32945 .0000074149 168 2003/ 12 7.55716 .0000751465 180 2004/ 12 9.19764 .0000087995* * INDICATES THE MOST RECENT SIGNIFICANT BREAK POINT: 1% SIGNIFICANCE LEVEL.
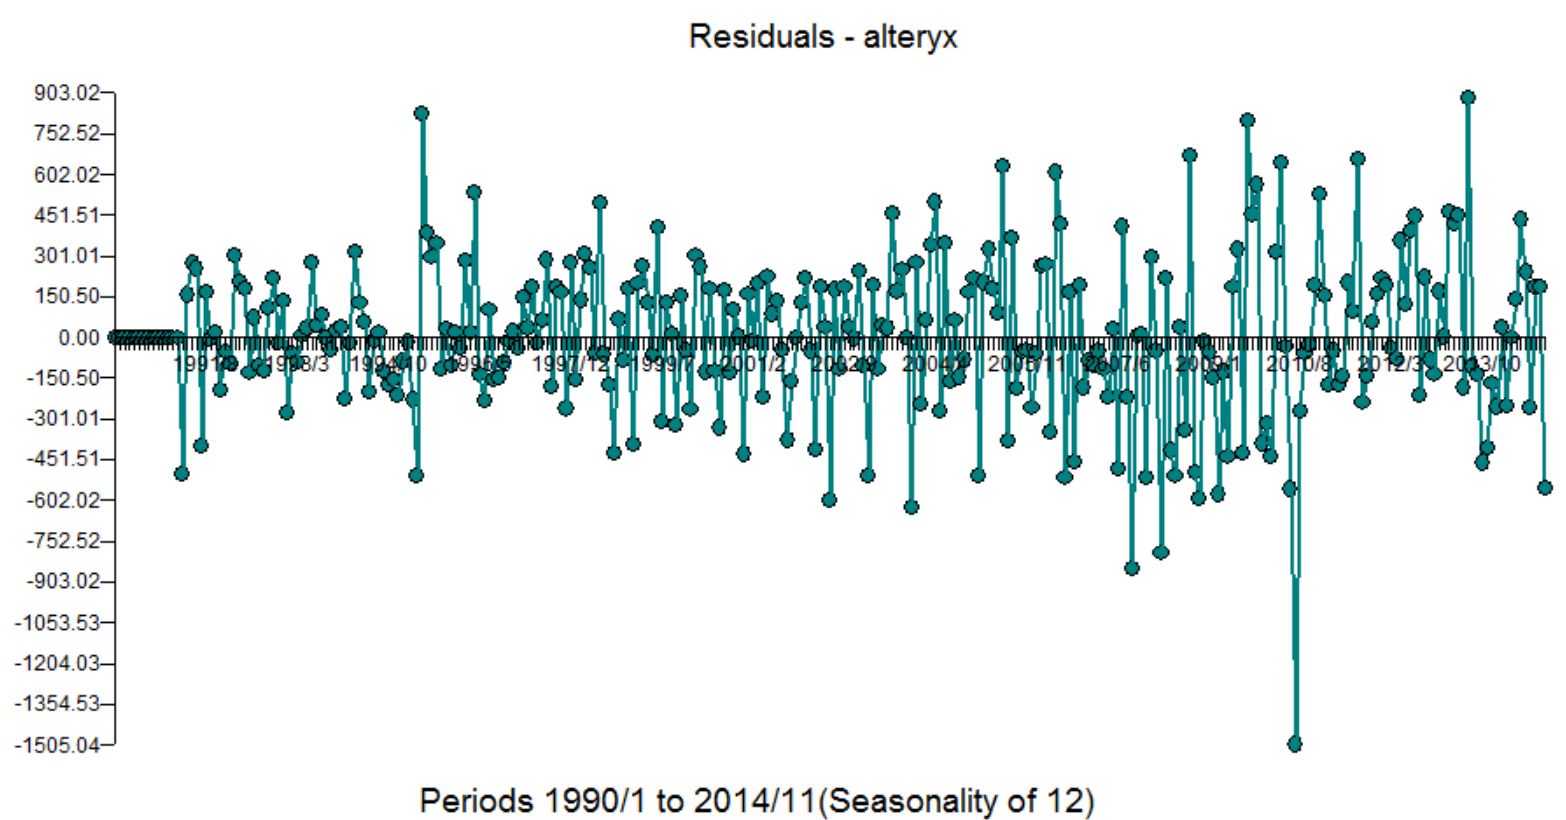
The model built using the more recent data had seasonal and regular differencing, an AR1 and a weak AR12. Two outliers were found at period 225(9/08) and 247(7/10). If you look at September's they are typically low, but not in 2008. July's are usually high, but not in 2010. If you don't identify and adjust for these outliers then you can never achieve a better model. Here is the Autobox model
[(1-B**1)][(1-B**12)]Y(T) =
         +[X1(T)][(1-B**1)][(1-B**12)][(-  831.26    )]       :PULSE          2010/  7   247
         +[X2(T)][(1-B**1)][(1-B**12)][(+  613.63    )]       :PULSE          2008/  9   225
        +     [(1+  .302B** 1)(1+  .359B** 12)]**-1  [A(T)]
Here is the table for forecasts for the 12 withheld periods.

Comments
-
Please login first in order for you to submit comments


